Could you tell me, what data you receive from the metering device? Does it report total consumed energy or momentary load?
I’m trying to understand what kind of data such devices report and how could we handle them.
I have recently bought a Zwave device that measure power. I’m not currently using it with HG but intend to. Currently trying it in Domoticz.
Haven’t checked all different types that is available. But the one I’m using now shows current load and todays total kwh.
This is the device I bought: https://www.fibaro.com/en/products/wall-plug/
Well, I finished rewriting statistics code from SQLite DB to LiteDB.
I tried not to change the logic behind statistics, but did some changes:
- lowered logging interval from 5 minutes to 30 seconds
- removed current day’s averages from hourly stats graph
But I’m not sure in handling Meter.Watts properties, because if I understand it right devices report their immediate watt load, so to calculate min/max/average power consumption during an hour we have to sum every value reported during that hour. But this approach leads to following graphs:
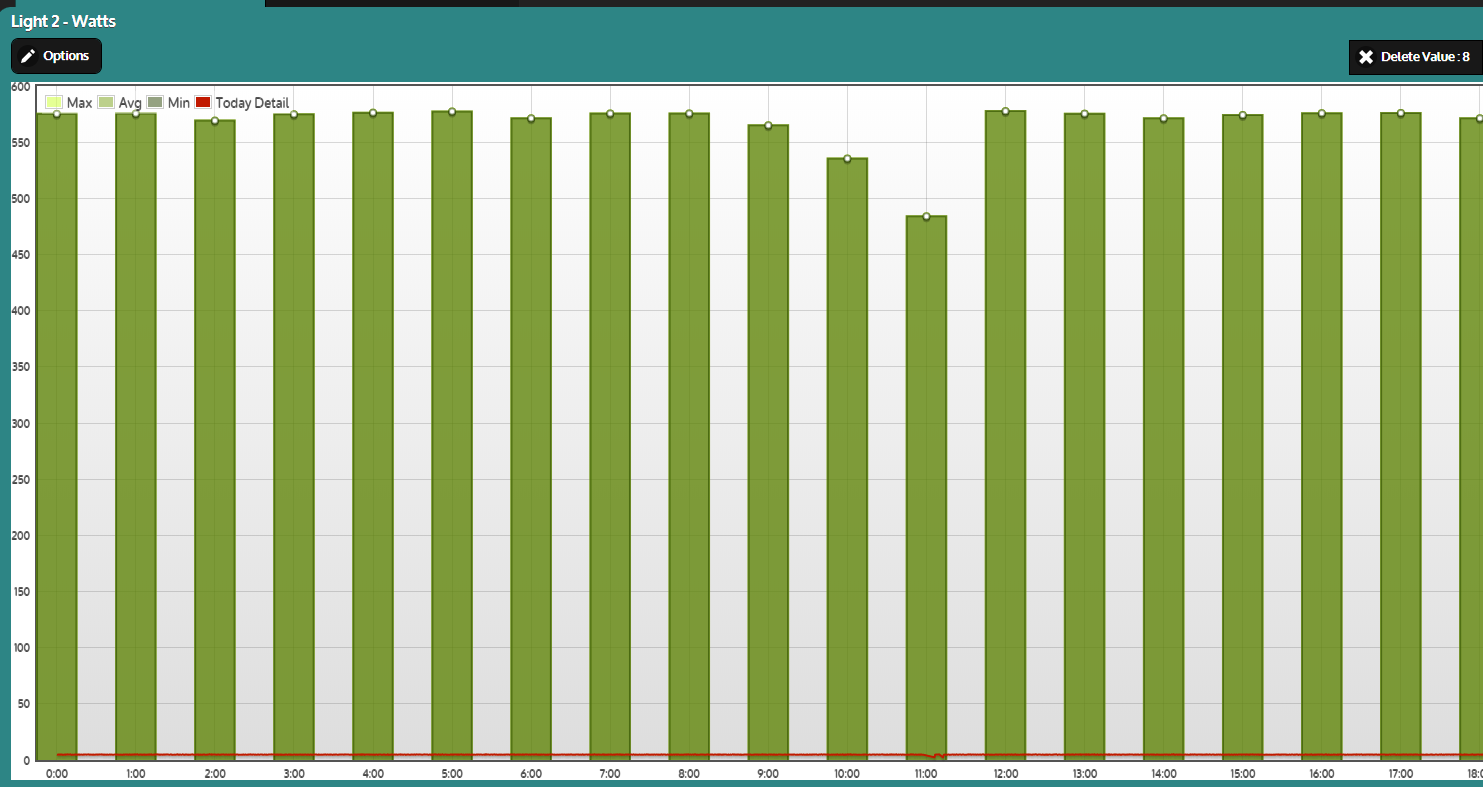
I think it should be more proper to use cumulative watt consumption metric as the base metric for calculation of hourly metrics.
What do think about this problem?
Got my Fibaro Wall Plug yesterday, but it doesn’t work properly with HG (or I subtilized with my HG installation).
By the way, what are you using these Wall Plugs for? To control what?
I’m using mine to control a heater for my fish pond. Don’t want the fishes to be popsicles. But would probably also have one to heat the car in the winter if I had a power outlet at my parking place.
Now that I think of it I should probably put one on my warm water tank in the house. Fun to see how much we spend on heating up the water. If the plug can handle the load.